|
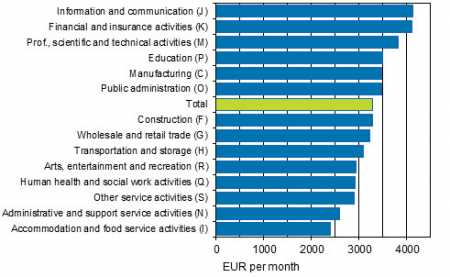
Thu, 09 Apr, 2015 12:08:19 AM FTimes Report, April 9  Average total earnings of full-time wage and salary earners in key industries (Standard Industrial Classification 2008) in 2013. Source: Structure of Earnings 2013, Statistics Finland. The highest average earnings EUR 4,124 were in information and communication activities in 2013, according to Statistics Finland’s Structure of Earnings data.
The average total earnings for fixed-term wage and salary earners in full-time employment were EUR 3,284 per month in the year.
The average earnings were lowest EUR 2,399 in accommodation and food service activities. Besides earnings for regular working hours, total earnings also include all bonuses and benefits in kind, but not one-off pay items, such as performance-based bonuses, the statistics show.
The level of average earnings in information and communication activities is explained by the enterprise and occupational structure.
The industry mainly consists of corporations in the media and software industry. The most common occupations in the industry include application analysts, IT support personnel, sales representatives, and magazine, radio and TV journalists.
Within the industry, the highest average earnings were found in the sub-industries software publishing (EUR 5,160) and computer programming, consultancy and related activities (EUR 4,273). The lowest average earnings were in the sub-industries sound recording and music publishing (EUR 3,686) and publishing of magazines and books (EUR 3,688).
The variation in total earnings was smallest in accommodation and food service activities, where ten per cent of full-time wage and salary earners earned less than EUR 1,820 per month (1st decile).
Ten per cent of the full-time wage and salary earners working in the industry earned more than EUR 3,108 per month (9th decile).
The median earnings were EUR 2,228: one-half of the full-time wage and salary earners in the industry earned more and one-half less than this.
The largest variation in earnings was found in financing and insurance activities, where the difference in total earnings between the first and ninth decile was 2.8-fold.
The corresponding figure for total industries was 2.3 and for accommodation and food service activities 1.7.
Total earnings in the 9th decile were highest in financing and insurance activities: EUR 6,593. Most performance-based bonuses in relative terms are paid in financing and insurance, which are not, however, included in total earnings.
The wage and salary earners with the lowest earnings worked in administrative and support service activities and other service activities.
In administrative and support service activities, ten per cent of full-time employees earned under EUR 1,701 per month while the corresponding sum in other service activities was EUR 1,753 as per the data.
Indicators of total earnings of full-time wage and salary earners by industry in 2013.
Source: Structure of Earnings 2013, Statistics Finland. More News
|
|
|||||||||||||||||||||||||||||||||||||||||||||||||||||||||||||||||||||||||||||||||||||||||||||||||||||||||
Finland Times
| Saturday, 24 January, 2026 |

