|
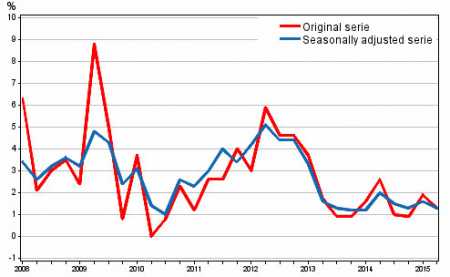
Wed, 09 Sep, 2015 12:51:30 AM FTimes Report, Sep 9  Year-on-year change in labour costs in the private sector from the corresponding quarter of the previous year. Source: Wages, Salaries and Labour Costs, Statistics Finland. Private sector labour costs rose by 1.3 per cent in April to June 2015, compared with the respective period of the year before.
Seasonally adjusted labour costs also went up by 1.3 per cent in the second quarter, according to Statistics Finland’s data.
Labour costs without one-off pay items, such as performance-based bonuses, increased by 1.0 per cent.
Over the same period, the index of wage and salary earnings for the private sector went up by 1.2 per cent.
In the public sector, the cost of an hour worked, however, decreased by 0.6 per year-on-year, the statistics show.
Labour costs without one-off pay items declined by 1.2 per cent over the same period. Seasonally adjusted labour costs went down by 1.0 per cent. Over the same period, the index of wage and salary earnings in the central government sector went up by 1.7 per cent.
In the local government sector, the cost of an hour worked rose by 2.1 per cent in the second quarter, compared with the respective period of the year before.
Labour costs without one-off pay items rose by 1.8 per cent. Over the same period, the index of wage and salary earnings in the local government sector went up by 1.0 per cent.
According to the Labour Cost Index, the wage and salary costs of the local government sector grew by 0.9 per cent and hours worked decreased by 0.9 per cent year-on-year.
The rise in social security costs played a part in accelerating the growth in the cost of labour for an hour worked in the local government sector.
The second quarter of 2015 had the same number of working days as one year earlier.
The cost per an hour worked in manufacturing industries decreased by 0.2 per cent, increased by 0.3 per cent in construction, and grew by 2.4 per cent in business service activities.
In manufacturing industries, the growth in the number of hours worked compared to the corresponding quarter last year slowed down the growth in costs.
According to the Labour Cost Index, wage and salary costs grew by 2.1 per cent at the same time. In construction, both wage and salary costs and hours worked diminished. In business service activities, wage and salary costs declined by 0.5 per cent and hours worked decreased by 3.2 per cent.
In manufacturing industries, the highest growth in the cost of an hour worked was found in the forest industry, 3.4 per cent, while in the metal industry, the cost decreased by 1.3 per cent.
Among service industries, growth was biggest in information and communication activities, 6.2 per cent. The costs grew by 1.7 per cent in financial and insurance activities, the data show.
The seasonally adjusted cost of an hour worked in all manufacturing went down by 0.3. In construction, it grew by 0.5 per cent and in business service activities by 2.0 per cent, according to the data.
In the forest industry, the seasonally adjusted cost of an hour worked went up by 2.6 per cent and in the metal industry it went down by 1.2 per cent year-on-year.
The costs increased by 2.0 per cent in financial intermediation and insurance activities.
In the index, hours worked or the structure of personnel have not been standardised.
In the index, the cost of an hour worked is calculated directly as the ratio of industry-specific wages and salaries sum and social insurance contributions to the hours worked for each quarter.
Year-on-year change in labour costs according to Standard Industrial Classification TOL 2008, 2nd quarter 2015
Source: Wages, Salaries and Labour Costs, Statistics Finland. More News
|
|
||||||||||||||||||||||||||||||||||||||||
Finland Times
| Thursday, 25 April, 2024 |

