|
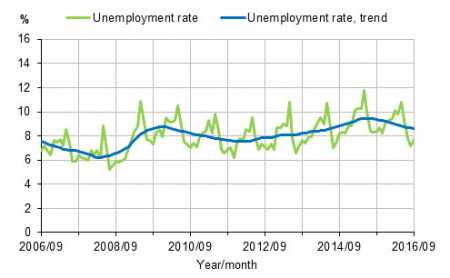
Wed, 26 Oct, 2016 12:04:38 AM FTimes Report, Oct 26  Unemployment rate and trend of unemployment rate 2006/09–2016/09, persons aged 15–74. Source: Labour force survey 2016, September. Statistics Finland. The unemployment rate was 7.7 per cent in September 2016, having been 8.4 per cent in September last year, according to Statistics Finland’s Labour Force Survey.
The number of unemployed persons in September was 204,000, which was 21,000 lower than one year ago.
There were 7,000 more employed than in September of the previous year. The unemployment rate was 7.6 per cent in the third quarter, having been 8.4 per cent in the respective quarter of 2015.
In September 2016, the number of employed persons was 2,459,000 which was 7,000 higher than a year earlier. There were 2,000 more employed men and 5,000 more employed women than in September 2015.
In September, the employment rate, that is, the proportion of the employed among persons aged 15 to 64, stood at 69.2 per cent, having been 68.8 per cent one year earlier.
From last year’s September, men’s employment rate rose by 0.5 percentage points to 70.2 per cent and women’s by 0.3 percentage points to 68.2 per cent.
Adjusted for seasonal and random variation, the trend of the employment rate was 68.9 per cent.
In September, there were a total of 635,000 young people aged 15 to 24. Of them, 252,000 were employed and 50,000 were unemployed.
The number of young people in the active population, both employed and unemployed in total, was 302,000.
In September, the unemployment rate for young people aged 15 to 24 stood at 16.5 per cent, which was 1.5 percentage points lower than one year previously.
The trend of the unemployment rate among young people was 20.0 per cent. The share of unemployed young people aged 15 to 24 among the population in the same age group was 7.8 per cent.
There were 1,445,000 persons in the inactive population in September 2016, which was 20,000 more than one year earlier.
Of the inactive population, 152,000 persons were in disguised unemployment, which was 4,000 fewer than in September 2015.
Changes in employment 2015/09 – 2016/09 according to Statistics Finland’s Labour Force Survey, population aged 15 to 74
Changes in employment 2015/III – 2016/III according to Statistics Finland’s Labour Force Survey, population aged 15 to 74
Changes 2015/09–2016/09 according to the Employment Service Statistics of the Ministry of Economic Affairs and Employment
Source: Labour force survey 2016, September. Statistics Finland.
More News
|
|
||||||||||||||||||||||||||||||||||||||||||||||||||||||||||||||||||||||||||||||||||||||||||||||||||||||||||||||||||||||||||||||||||||||||||||||||||||||||
Finland Times
| Monday, 16 February, 2026 |

