|
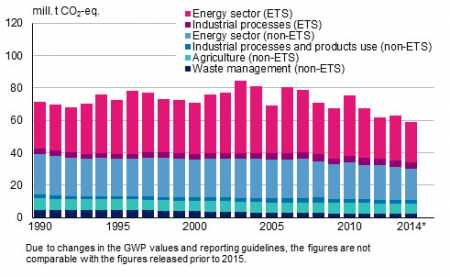
Tue, 15 Dec, 2015 12:01:25 AM FTimes Report, Dec 15  Greenhouse gas emissions of the emissions trading sector (ETS) and the non-emissions trading sector (non-ETS) by sector in 1990 to 2014 (million tonnes of CO2 eq.). The data concerning 2014 are preliminary. Source: Greenhouse gas inventory unit, Statistics Finland. Finland's greenhouse gas emissions amounted to 59.1 million tonnes of carbon dioxide (CO2 eq.) in 2014, which was 12 million tonnes less than in the comparison year 1990.
The trend of emissions has been declining for the past ten years, according to the data based on Statistics Finland’s preliminary report on emissions in 2014.
The report is to be submitted to the European Commission on 15 January 2016.
Compared with the previous year, the total emissions decreased by seven per cent and emissions from the non-emissions trading sector by four per cent.

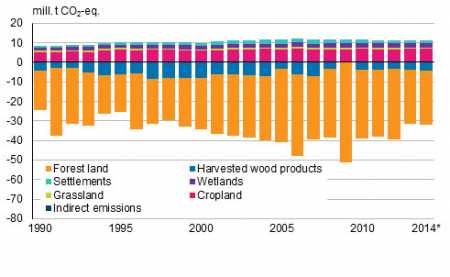
Greenhouse gas emissions and removals in the land use, land use change and forestry sector (LULUCF sector) in 1990 to 2014 (million tonnes of CO2 eq.) (emissions are positive and removals negative figures). Data concerning 2014 are preliminary. Source: Greenhouse gas inventory unit, Statistics Finland. Emissions from the non-emissions trading sector were below the annual emission allocations set by the EU by 1.1 million tonnes.
Total emissions decreased by seven per cent; emissions in the energy sector fell by eight per cent and in the waste sector by six per cent. Emissions from industrial processes and product use, as well as from agriculture remained on level with the previous year.
In the energy sector, the use of hard coal, oil products and natural gas decreased, and the use of peat and bio-fuels increased.
The removals by land use, land-use change and forestry sector (LULUCF) increased by around two per cent compared to the previous year and amounted to 21 million tonnes of CO2.
Greenhouse gas emissions in Finland by sector. Emissions, million tonnes of CO2 eq. Negative figures are removals of greenhouse gases. The data concerning 2014 are preliminary
2) Other energy includes sub-gategories heating of buildings, other fuel use in agriculture, forestry and fisheries, working machines in the sector, other fuel use and fugitive emissions from fuels 3) F-gases refer to fluorinated greenhouse gases (HFC, PFC compounds, SF6 and NF3) Greenhouse gas emissions broken down between emissions trading sectors and non-emissions trading sources in 2005, 2008 to 2010, and 2013 to 2014 (million t CO2 eq.) The data concerning 2014 are preliminary
2) Source: Energy Authority. In 2013, emissions trading was expanded with new sectors 3) Excluding CO2 emission from domestic civil aviation according to the inventory Source: Greenhouse gas inventory unit, Statistics Finland. More News
|
|
|||||||||||||||||||||||||||||||||||||||||||||||||||||||||||||||||||||||||||||||||||||||||||||||||||||||||||||||||||||||||||||||||||||||||||||||||||||||||||||||||||||||||||||||||||||||||||||||||||||||||||||||||||||||
Finland Times
| Sunday, 19 October, 2025 |

