|
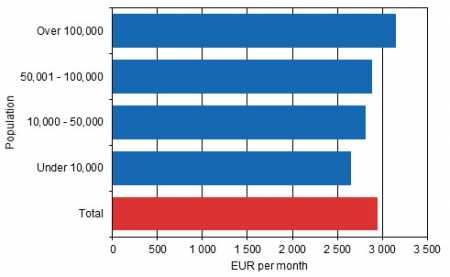
Fri, 08 Apr, 2016 12:02:40 AM FTimes Report, Apr 8  Median of total earnings of full-time wage and salary earners according to the population of the municipality of where the workplace is located in 2014. Source: Structure of Earnings 2014, Statistics Finland. Median earnings of wage and salary earners were the highest in the densely-populated areas, according to Statistics Finland's data.
The median of total earnings of full-time wage and salary earners was EUR 3,143 per month in 2014when their workplace was located in a municipality of over 100,000 inhabitants, the Structure of Earnings statistics show.
The corresponding median earnings were EUR 2,647 per month in a municipality of under 10,000 inhabitants.
The size of the municipality where the workplace is located is connected to the earnings of wage and salary earners.
In 2014, the median of total earnings of full-time wage and salary earners was EUR 2,946. One-half of wage and salary earners made more than that and one half less than that.
Around 50 per cent of the wage and salary earners in the statistics were working in municipalities of over 100,000 inhabitants. These municipalities were Helsinki, Espoo, Tampere, Vantaa, Oulu, Turku, Jyväskylä, Lahti and Kuopio.
In the group formed of these municipalities of over 100,000 inhabitants, the median of total earnings was highest in five main groups of the Classification of Occupations (AML 2010).

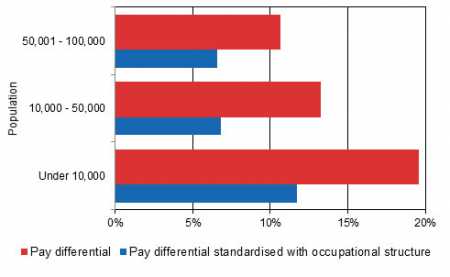
Pay differential by the size of workplace location compared to municipalities of over 100,000 inhabitants in 2014. Source: Structure of Earnings 2014, Statistics Finland. These groups were managers, professionals, technicians and associate professionals, clerical support workers, and service and sales workers.
Correspondingly, in the group formed of municipalities of under 10,000 inhabitants, the median of total earnings was lowest in all main groups of the Classification of Occupations, except for the group of skilled agricultural, forestry and fishery workers.
If all wage and salary earners are placed in the order of size of their pay, the pay of the midmost wage and salary earner is the median pay. Total earnings include regular working time, overtime compensations, all bonuses and benefits in kind.
A full-time wage and salary earner refers to a wage or salary earner who has worked a full working week during the statistical reference month.
The median earnings of managers were EUR 6,166 per month in municipalities of over 100,000 inhabitants and EUR 4,592 in municipalities of under 10,000 inhabitants.
The median earnings of managers were thus 34 per cent higher in municipalities of over 100,000 inhabitants than in municipalities of under 10,000 inhabitants.
The corresponding difference for professionals was 16 per cent and for technicians and associate professionals 13 per cent, according to the data.
For clerical support workers, the difference in median earnings between the biggest and smallest municipality workplace groups was eight per cent. The corresponding difference for service and sales workers was two per cent.
The difference was smallest in median earnings in the occupational group of elementary occupations, where the difference between municipalities of over 100,000 inhabitants and under 10,000 inhabitants was around one per cent.

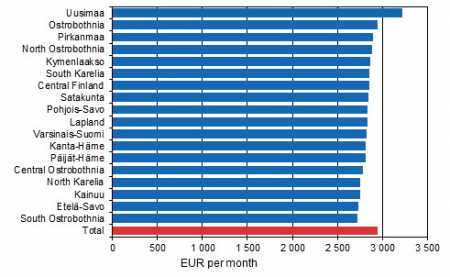
Median of total earnings of full-time wage and salary earners by region in 2014. Source: Structure of Earnings 2014, Statistics Finland. The occupational group includes cleaning workers and other assisting workers in different fields.
If municipalities of over 100,000 inhabitants in Uusimaa, that is, Helsinki, Espoo and Vantaa, were removed from the examination, the median earnings would be even higher in large than small municipalities in nearly all main groups of the Classification of Occupations.
There are occupational groups in service industries where the median earnings are higher in small than larger municipalities.
The median earnings of cooks and food service counter attendants were highest when they were working in municipalities of under 10,000 inhabitants. Office cleaners had the highest median earnings in municipalities with 10,000 to 50,000 inhabitants.
The median earnings of general medical practitioners were 16 per cent higher in municipalities of under 10,000 inhabitants than in municipalities of over 100,000 inhabitants.
The mean and median of total earnings of full-time employees are the higher the bigger the workplace municipality is as per the data.
In 2014, the difference in the mean earnings of full-time wage and salary earners was around 20 per cent between a municipality of over 100,000 inhabitants and a municipality of 10,000 inhabitants. When the occupational structure is standardised, the difference lowers to 12 per cent.
The Structure of Earnings statistics for 2014 provide data on the earnings of around 1.6 million full time and part time wage and salary earners.
Median of total earnings of full-time wage and salary earners by the main group of the Classification of Occupations (AML 2010) and the population of the municipality where the workplace is located in 2014
Median of total earnings of full-time wage and salary earners in certain occupational groups (AML 2010) and the population of the municipality where the workplace is located in 2014
More News
|
|
|||||||||||||||||||||||||||||||||||||||||||||||||||||||||||||||||||||||||||||||||||||||||||||||||||||||||||||||||||||||||||||||||||||||||||||||||
Finland Times
| Saturday, 20 December, 2025 |

