|
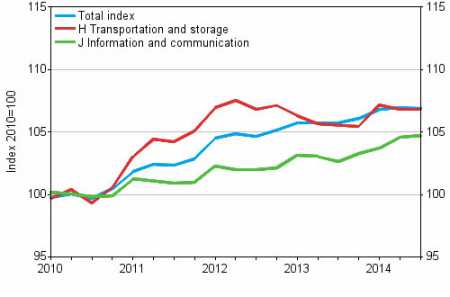
Mon, 27 Oct, 2014 12:07:06 AM FTimes Report, Oct. 27  Producer Price Indices for Services 2010=100, I/2010–III/2014. Source: Producer Price Indices for Services 2014, 3rd quarter. Statistics Finland. Producer prices for services went up by 1.1 per cent in the third quarter of 2014 from the corresponding quarter of the year before, thanks to higher prices of software and related services.
According to Statistics Finland, higher prices of software and related services and postal activities under universal service obligation during the year pushed up the producer prices for services.
The increase in the total index was also affected by higher rents of office and business premises and increased prices of real estate management services. The rise was held back by, among other things, lower prices of management consulting services, cargo handling and advertising services.
Producer Price Indices for Services describe the price development in business services provided by enterprises to other enterprises and the public sector. The total index currently covers 57 per cent of the market services.
From the third quarter of 2014 onwards, new index series that depict the price development of services offered to all end users will be published in connection with the Producer Price Index for Services.
New B-to-All index series are published for the H 50 Water transport, H 53 Post and courier activities and J 61 Telecommunications industries.
The publication of B-to-All indices is part of a larger revision of the Producer Price Index for Services, in connection with which the description of the index will be expanded.
In addition to the price development of the Business to Business (B-to-B) services and services enterprises produce for the public sector currently included in the index, in future it will also describe the price development of Business to Consumers (B-to-C) and Business to All (B-to-All) services.
Producer Price Indices for Services 2010=100, 3rd quarter 2014
Source: Producer Price Indices for Services 2014, 3rd quarter. Statistics Finland.
More News
|
|
Finland Times
| Monday, 29 April, 2024 |

