|
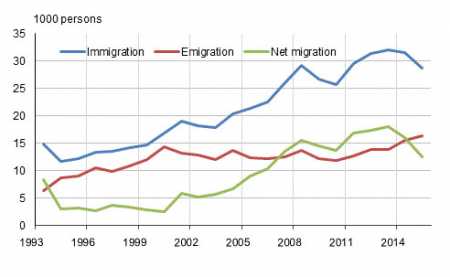
Wed, 18 May, 2016 12:02:36 AM FTimes Report, May 18  Migration between Finland and other countries 1993–2015. Source: Population and Justice Statistics. Statistics Finland. Finland’s gain in international migration went down by 3,580 persons in 2015 from one year earlier, according to Statistics Finland.
Last year, net immigration amounted to 12,441 persons, which was the smallest number in nine years.
Finland received a migration gain of 14,737 persons from immigration of foreign citizens.
In 2015, a total of 28,746 persons immigrated to Finland from foreign countries, 2,761 lower than one year before.
Emigration to abroad from Finland increased by 819 persons and amounted to 16,305. The net immigration totalled 12,441 persons in 2015.
Last year, 10,899 persons moved from Finland to other EU countries. Emigration to the EU countries was 790 persons up on the year before.
Immigration from the EU countries to Finland decreased by 2 288 persons and amounted to 13,090.
In 2015, Finland had a migration gain of 2,191 persons from the EU countries. Finland’s migration gain from the EU countries was clearly lower than in the previous year, the data show.
The number of inter-municipal migrations totalled 280,484, which was 11,976 more than in 2014. The number of migrations between regions was 132,657 and it grew by 7,574.
Altogether 4,402 more migrations inside regions were made than in 2014. Intra-municipal migrations numbered 613,201, which is 42,135 more than in 2014.
The region of Uusimaa had the largest and the region of Pirkanmaa the second largest migration gain as per the statistics.
In Uusimaa, the gain amounted to 5,949 and in Pirkanmaa to 1,367 persons.
The region having suffered the largest population loss in migration inside the country was North Ostrobothnia, where the migration loss was 1,044 persons.
Kainuu had the largest relative migration loss of eight per mil. Relative migration loss was the second largest in Lapland.
Fourteen regions suffered migration loss in intra-municipal migration.
No region suffered migration loss in migration between foreign countries.
The sum of net immigration and net emigration was negative in ten regions. In relative terms, the biggest migration gain in Mainland Finland from international migration was seen in Ostrobothnia and the smallest in South Ostrobothnia.
Internal migration and in- and out-migration 2005–2015
Source: Population and Justice Statistics. Statistics Finland. More News
|
|
Finland Times
| Wednesday, 10 December, 2025 |

