|
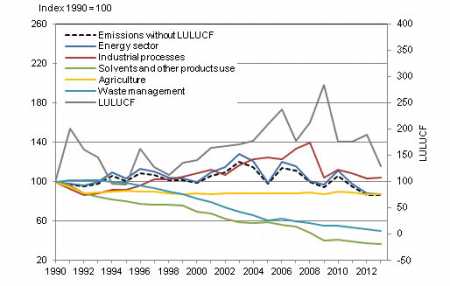
Fri, 23 May, 2014 12:08:43 AM FTimes Report, May 23  Development of greenhouse gas emissions by sector in Finland in 1990–2013. The data concerning 2013 are preliminary. Source: Statistics Finland. The emissions of greenhouse gases in the country remained almost unchanged in 2013 which corresponded with 60.6 million tonnes of carbon dioxide.
According to Statistics Finland’s proxy estimate, the total emissions of greenhouse gases in 2013 corresponded with 60.6 million tonnes of carbon dioxide which is almost similar to that of the year before.
In the energy sector, the use of hard coal increased but the consumption of peat, oil and natural gas decreased. In 2013, emissions outside the emissions trading scheme were around six per cent below the target set by the EU.
The net sink of the Land Use, Land-Use Change and Forestry (LULUCF) sector has decreased by one-third as a result of increased felling.
The monitoring of the effort sharing decision of the EU's climate change package requires emissions data to be broken down to non-emissions trading scheme emissions and emissions trading scheme emissions.
Annual emission limitations or reductions have been set for non-emissions trading scheme emissions and emissions trading scheme emissions.
Emissions trading scheme emissions grew by close on seven per cent in 2013 compared to the previous year partially due to emissions trading being expanded into new activities.
In sectors outside the emissions trading scheme (e.g. use of fuel in heating of buildings, transport excl. civil aviation, agriculture, waste management and consumption of F-gases) emissions in turn decreased by good seven per cent.
In the effort sharing decision, the target for Finland non-emissions trading scheme emissions is a reduction obligation of 16 per cent between the emissions in 2005 and the emissions in 2020.
Between 2013 and 2020, the emissions must be on the so-called target path or below.
The path is linear and it’s starting point is the average of emissions from non-emissions trading scheme sources in 2008 to 2010 and its final point is the target for emissions reduction by 2020.
Because emissions outside the non-emissions trading scheme emissions are calculated as the difference between reviewed total emissions and emissions trading scheme emissions, the effects from emissions that are moved into the emissions trading scheme in 2013 have also been taken into consideration when determining the path.
Finland's emissions volume for 2013 according to the target path is thus around 31.0 million tonnes of carbon dioxide equivalent (CO2 eq.). According to the proxy estimate, the actual emissions are two million tonnes of carbon dioxide equivalent (CO2 eq.) below the target level.
Finland's greenhouse gas emissions by sector (million tonnes of CO2 eq.). Negative figures indicate removal of greenhouse gases from the atmosphere
1) Proxy estimate
Greenhouse gas emissions and removals broken down between emissions trading scheme sources and non-emissions trading scheme sources in 2005 and 2008 to 2013 (million tonnes CO2 eq.). Negative figures indicate removal of greenhouse gases from the atmosphere
1) Source: Energy Authority. In 2013, emissions trading was expanded with new sectors
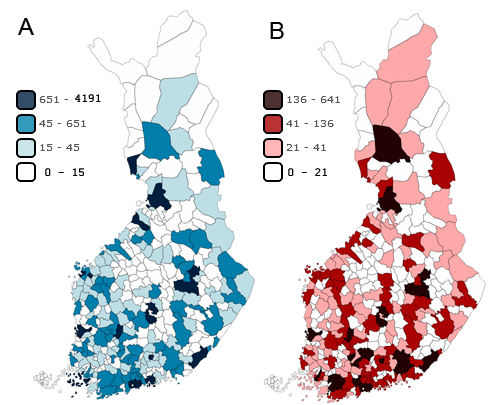
A) Greenhouse gas emissions from the energy sector and industrial processes by municipality in 2012 (1,000 t CO2 eq.) B) Greenhouse gas emissions from transport by municipality in 2012 (1,000 t CO2 eq.)
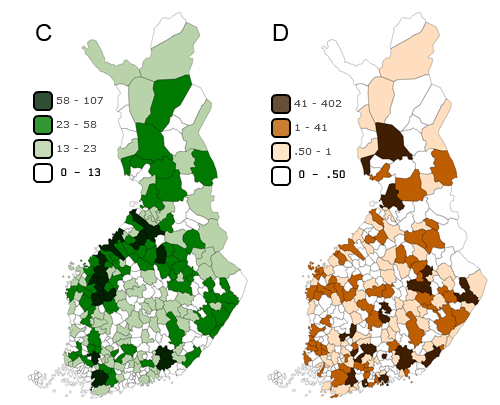
C) Greenhouse gas emissions from agriculture by municipality in 2012 (1,000 t CO2 eq.) D) Greenhouse gas emissions from the waste sector by municipality in 2012 (1,000 t CO2 eq.)
Source: Greenhouse gas inventory unit, Statistics Finland More News
|
|
||||||||||||||||||||||||||||||||||||||||||||||||||||||||||||||||||||||||||||||||||||||||||||||||||||||||||||||||||||||||||||||||||||||||||||||||||||||||||||||||||||||||||||||||||||||||||||||||||||||||||||||||||||||||||
Finland Times
| Saturday, 27 April, 2024 |


